Cron jobs handle critical automation in Unix-like systems—from database backups to log rotation—yet they fail silently by design. When a scheduled task stops working, you might not discover the failure until days later, potentially causing data loss or system degradation.
Understanding where crontab logs are stored and how to monitor them effectively is essential for maintaining reliable automated systems. This guide covers log locations across different distributions, debugging failed jobs, and implementing robust monitoring practices that catch issues before they escalate.
Crontab Log Locations by Distribution
Cron log locations vary significantly across Unix-like systems. Knowing where to look saves critical time during incidents.
Ubuntu and Debian Systems
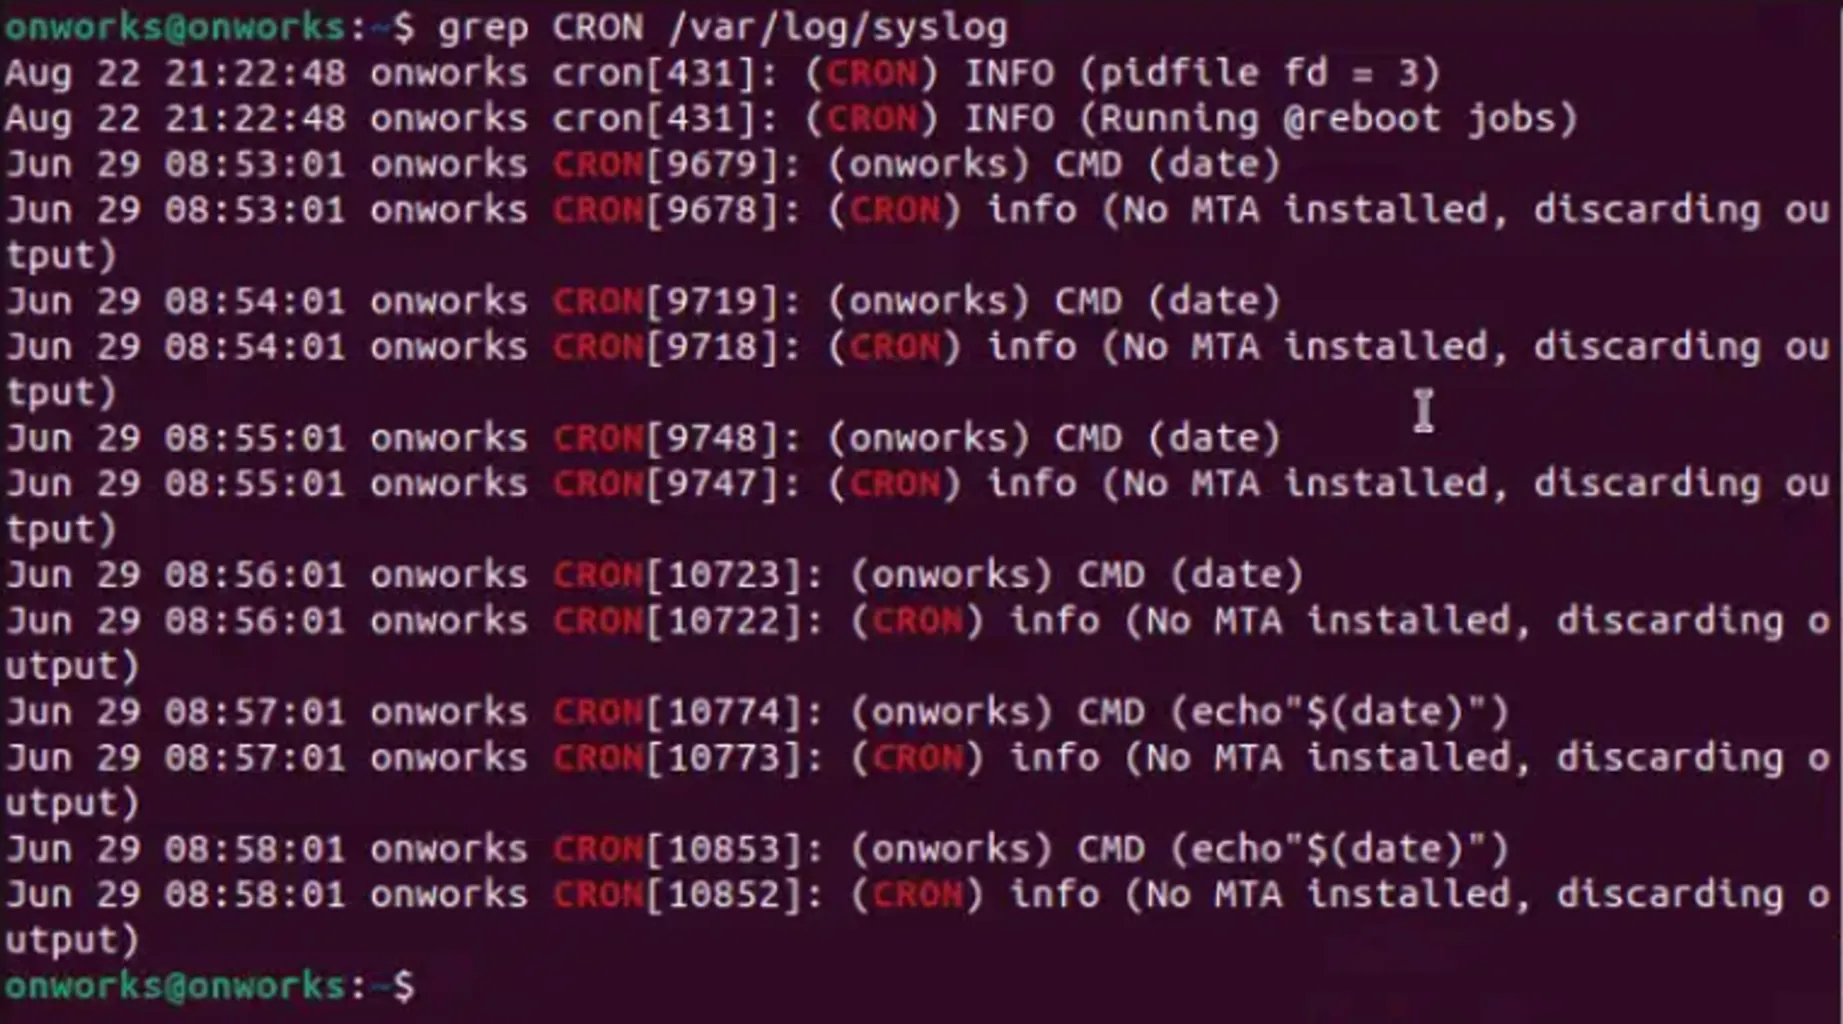
Cron logs are written to the system log at /var/log/syslog. Filter for cron-specific entries:
grep CRON /var/log/syslog
For recent activity with timestamps:
grep CRON /var/log/syslog | tail -20
Red Hat, CentOS, and Fedora Systems
These distributions maintain a dedicated cron log:
tail -f /var/log/cron
View specific time ranges:
grep "$(date '+%b %d')" /var/log/cron
macOS Systems
Cron logging is minimal by default. Check system logs and user mail:
grep cron /var/log/system.log
# Check for output sent to mail
mail
systemd-Based Systems
Modern distributions use systemd's journal:
journalctl -u cron.service
# Real-time monitoring
journalctl -u cron.service -f
# Filter by date range
journalctl -u cron --since "2025-07-23 00:00:00" --until "2025-07-23 23:59:59"
What System Logs Actually Show
Default system logs only record cron job execution events, not job output or success status. A typical entry looks like:
Jul 23 10:15:01 server CRON[12345]: (root) CMD (/usr/local/bin/backup.sh)
This confirms the job started but provides no information about:
- Whether the script succeeded or failed
- What output the script generated
- How long execution took
- Any errors encountered
For meaningful monitoring, you need custom logging strategies.
Advanced Log Analysis Techniques
Finding Failed Jobs
System logs rarely contain failure information directly. Look for patterns:
# Search for error indicators
grep -i "failed\|error" /var/log/cron

# Find jobs that started but may have issues
grep CMD /var/log/syslog | grep -v "pam_unix"
Analyzing Job Patterns
# Count executions per user
grep CRON /var/log/syslog | awk '{print $6}' | sort | uniq -c

# Identify most frequent jobs
grep CMD /var/log/syslog | awk -F'CMD ' '{print $2}' | sort | uniq -c | sort -nr

# Check for missing expected jobs
grep "backup.sh" /var/log/syslog | tail -10
Creating Effective Custom Logging
Since default logging is insufficient, implementing custom log capture is essential for production systems.
Basic Output Redirection
Capture both stdout and stderr:
# Append all output to custom log
0 2 * * * /usr/local/bin/backup.sh >> /var/log/backup.log 2>&1

# Separate success and error logs
0 2 * * * /usr/local/bin/backup.sh >> /var/log/backup.log 2>> /var/log/backup-errors.log
Enhanced Logging with Timestamps
Create a logging wrapper script:
#!/bin/bash
# /usr/local/bin/cron-logger.sh
LOGFILE="/var/log/cron-jobs.log"
SCRIPT="$1"

echo "$(date '+%Y-%m-%d %H:%M:%S') - Starting: $SCRIPT" >> $LOGFILE
"$@" >> $LOGFILE 2>&1
EXIT_CODE=$?
echo "$(date '+%Y-%m-%d %H:%M:%S') - Completed: $SCRIPT (Exit: $EXIT_CODE)" >> $LOGFILE

exit $EXIT_CODE
Use in crontab:
0 2 * * * /usr/local/bin/cron-logger.sh /usr/local/bin/backup.sh
Structured Logging for Better Parsing
For automated monitoring and alerting:
#!/bin/bash
# Enhanced structured logging
LOGFILE="/var/log/cron-structured.log"
JOB_NAME="$(basename $1)"
START_TIME=$(date '+%Y-%m-%d %H:%M:%S')
START_TIMESTAMP=$(date +%s)

echo "{\"timestamp\":\"$START_TIME\",\"job\":\"$JOB_NAME\",\"status\":\"started\"}" >> $LOGFILE

"$@" >> $LOGFILE 2>&1
EXIT_CODE=$?

END_TIME=$(date '+%Y-%m-%d %H:%M:%S')
DURATION=$(( $(date +%s) - START_TIMESTAMP ))

echo "{\"timestamp\":\"$END_TIME\",\"job\":\"$JOB_NAME\",\"status\":\"completed\",\"exit_code\":$EXIT_CODE,\"duration\":$DURATION}" >> $LOGFILE

exit $EXIT_CODE
Debugging Failed Cron Jobs
Cron job failures often stem from environment differences between interactive shells and the minimal cron environment.
Environment Variable Issues
Cron runs with a stripped-down environment. Debug by capturing the environment:
# Capture cron's environment
* * * * * /usr/bin/env > /tmp/cron-env.log 2>&1
Common solution—explicitly set PATH:
PATH=/usr/local/sbin:/usr/local/bin:/usr/sbin:/usr/bin:/sbin:/bin
0 2 * * * /usr/local/bin/backup.sh
Permission and Access Problems
Verify script permissions and ownership:
# Check script permissions
ls -la /path/to/script.sh

# Test execution as the cron user
sudo -u username /path/to/script.sh

# Verify crontab file permissions
ls -la /var/spool/cron/crontabs/$(whoami)
Testing Cron Job Scripts
Simulate the cron environment for testing:
# Run with minimal environment
env -i /bin/bash --noprofile --norc -c "/path/to/script.sh"

# Test with cron-like PATH
env -i HOME=/home/user PATH=/usr/bin:/bin /path/to/script.sh > /tmp/test.log 2>&1
Enable Debug Logging
For systemd-based systems: Debug logging on systemd-based systems is typically handled through the system logger configuration and journal settings. You can increase verbosity by:
# Check the actual cron service name (varies by distribution)
systemctl status cron crond cronie 2>/dev/null | grep -E "(cron|crond|cronie).service"

# View detailed cron logs through journalctl
journalctl -u cron -f  # Use 'crond' or 'cronie' if that's your service name

# For more verbose system logging, configure rsyslog
# Edit /etc/rsyslog.conf or /etc/rsyslog.d/50-default.conf
# Ensure cron logging is enabled:
# cron.*    /var/log/cron.log
For traditional cron (RHEL/CentOS):
# Edit /etc/sysconfig/crond
CRONDARGS="-x ext,sch,proc,pars,load,misc,test"
systemctl restart crond
Production-Ready Monitoring Strategies
Effective cron monitoring requires proactive alerting and systematic health tracking.
Log Rotation Configuration
Prevent log files from consuming disk space with proper rotation:
# Create /etc/logrotate.d/cron-custom
/var/log/cron-jobs.log {
    daily
    rotate 30
    compress
    delaycompress
    missingok
    create 640 root root
    postrotate
        /bin/kill -HUP $(cat /var/run/rsyslogd.pid 2>/dev/null) 2>/dev/null || true
    endscript
}
Automated Failure Alerting
Build failure notifications into your scripts:
#!/bin/bash
# Enhanced script with built-in alerting
SCRIPT_NAME="$(basename $0)"
LOG_FILE="/var/log/${SCRIPT_NAME}.log"

exec > >(tee -a $LOG_FILE)
exec 2>&1

echo "$(date '+%Y-%m-%d %H:%M:%S') - Starting $SCRIPT_NAME"

# Your actual script logic here
your_command_here

EXIT_CODE=$?

if [ $EXIT_CODE -ne 0 ]; then
    echo "$(date '+%Y-%m-%d %H:%M:%S') - FAILED: $SCRIPT_NAME (Exit: $EXIT_CODE)"
    echo "Script: $SCRIPT_NAME failed with exit code $EXIT_CODE" | \
        mail -s "Cron Job Failure: $SCRIPT_NAME" ops-team@company.com
else
    echo "$(date '+%Y-%m-%d %H:%M:%S') - SUCCESS: $SCRIPT_NAME completed"
fi

exit $EXIT_CODE
Health Check Integration
Integrate with external monitoring services:
# Success ping to monitoring service
0 2 * * * /usr/local/bin/backup.sh && curl -fsS --retry 3 https://hc-ping.com/your-uuid

# Or send both success and failure signals
0 2 * * * /usr/local/bin/backup.sh && curl -fsS https://hc-ping.com/success-uuid || curl -fsS https://hc-ping.com/fail-uuid
Get Started with SigNoz for Centralized Cron Log Management
Managing cron logs across multiple servers becomes complex quickly. SigNoz provides comprehensive log management capabilities specifically designed for monitoring distributed systems and automated processes like cron jobs.
Key SigNoz Features for Cron Job Monitoring
Centralized Log Collection: SigNoz consolidates cron logs from all your servers using the OpenTelemetry Collector. Configure the collector with a syslog receiver to capture system logs (including cron logs from /var/log/syslog or /var/log/cron) or collect custom log files created by your cron jobs directly.
Ultra-Fast Log Analysis: Built on ClickHouse, SigNoz delivers exceptionally fast log querying and analysis. The intuitive query builder lets you filter by job names, exit codes, execution times, or error patterns without learning complex query languages.
Proactive Alerting: Set up alerts based on cron job patterns such as:
- Jobs that haven't executed within expected schedules
- Failed jobs based on exit codes or error messages
- Unusual execution durations indicating performance issues
- Missing health check pings from critical automation
Unified Observability: Unlike traditional log management tools, SigNoz combines logs, metrics, and distributed traces in a single platform. This enables you to correlate cron job issues with system performance metrics, application errors, or infrastructure problems.
Example OpenTelemetry Collector Configuration for Cron Logs:
receivers:
  syslog:
    tcp:
      endpoint: "0.0.0.0:5140"
  filelog:
    include: [ "/var/log/cron-jobs.log" ]

processors:
  batch:

exporters:
  otlp:
    endpoint: "https://ingest.{region}.signoz.cloud:443"

service:
  pipelines:
    logs:
      receivers: [syslog, filelog]
      processors: [batch]
      exporters: [otlp]
You can choose between various deployment options in SigNoz. The easiest way to get started with SigNoz is SigNoz cloud. We offer a 30-day free trial account with access to all features.
Those who have data privacy concerns and can't send their data outside their infrastructure can sign up for either enterprise self-hosted or BYOC offering.
Those who have the expertise to manage SigNoz themselves or just want to start with a free self-hosted option can use our community edition.
Hope we answered all your questions regarding crontab logs. If you have more questions, feel free to use the SigNoz AI chatbot, or join our slack community.
Key Takeaways
Effective cron job management requires understanding these fundamental principles:
- System logs show execution, not results - Default logs only confirm jobs started, not whether they succeeded
- Custom logging is mandatory - Implement output redirection and structured logging for meaningful monitoring
- Environment differences cause most failures - Cron's minimal environment often breaks scripts that work interactively
- Proactive monitoring prevents incidents - Set up alerting before jobs fail, not after discovering problems
- Centralized solutions scale effectively - Use log management platforms for production environments with multiple servers
Implementing these practices transforms cron job management from reactive troubleshooting to proactive system reliability.
Frequently Asked Questions
Where can I see the logs of crontab?
Cron logs are located in /var/log/syslog (Ubuntu/Debian), /var/log/cron (RHEL/CentOS), or accessed via journalctl -u cron on systemd systems. Use grep CRON /var/log/syslog to filter for cron entries.
How to make a crontab log?
Create custom logs by redirecting output: * * * * * /path/to/script.sh >> /var/log/custom.log 2>&1. This captures both standard output and errors to your specified log file with timestamps.
How to check if a cron job ran successfully?
Check system logs for execution records, then examine custom log files for actual job output and exit codes. Implement health check pings or email notifications for critical jobs.
How to view crontab status?
View cron service status with systemctl status cron (Ubuntu/Debian) or systemctl status crond (RHEL/CentOS). List active crontabs with crontab -l and check system jobs in /etc/crontab.
How do I view cron entries?
Use crontab -l for personal entries, sudo crontab -u username -l for other users, and examine /etc/crontab and /etc/cron.d/ for system-wide scheduled tasks.
How to check crontab edit history?
Crontab doesn't maintain edit history by default. Create backups before changes: crontab -l > crontab-backup-$(date +%Y%m%d).txt to track modifications manually.
Where is the crontab directory?
User crontabs are stored in /var/spool/cron/crontabs/ (Debian) or /var/spool/cron/ (Red Hat). System cron files are in /etc/crontab and /etc/cron.d/.
How to test a crontab job?
Test with cron-like environment: env -i HOME=/home/user PATH=/usr/bin:/bin /path/to/script.sh. Set temporary frequent schedules for testing, then adjust timing once validated.
How do I see all cron jobs running?
Check all sources: user crontabs (crontab -l for each user), system crontabs (/etc/crontab, /etc/cron.d/), and scheduled directories (/etc/cron.hourly/ etc.).
Where are crontab files stored?
Individual crontabs: /var/spool/cron/crontabs/username (Debian) or /var/spool/cron/username (Red Hat). System files: /etc/crontab, /etc/cron.d/, and /etc/cron.{hourly,daily,weekly,monthly}/.
Enhance your system administration skills with our guides on log management and collecting system logs.
