Redis is a powerful tool, but its position in the critical path of applications means that performance issues can have a widespread impact. Whether you use Redis as a cache, session store, or primary database, effective monitoring is essential to prevent slowdowns and ensure a responsive user experience.
This guide provides a comprehensive walkthrough of Redis monitoring, covering the essential metrics you need to track, the tools available to you, and the best practices to adopt in 2025.
What is Redis and Why Monitor It?
Redis (Remote Dictionary Server) is an in-memory data structure store that serves several key roles in modern application architectures:
- Cache: With its sub-millisecond data retrieval, Redis is ideal for caching frequently accessed data, such as API responses and database query results.
- Session store: It provides a fast and consistent way to store user sessions in distributed systems.
- Message broker: Redis supports publish/subscribe messaging patterns and various data structures for building message queues.
- Primary database: For use cases that require rapid read/write operations, Redis is increasingly being used as a primary database.
Given its central role, any degradation in Redis performance can cascade through your system, leading to frustrated users and potential failures. Effective monitoring provides the early warnings and actionable insights needed to prevent these issues before they escalate.
Essential Redis Metrics
To effectively monitor Redis, you need to understand which metrics to track. These can be grouped into several key categories that together provide a holistic view of your Redis instance's health:
- Performance metrics that measure response times and throughput
- Memory metrics that track resource utilization
- Activity metrics that show client behavior
- Persistence metrics for data durability
- Error metrics that capture potential problems
Performance Metrics
Performance metrics are the first place you'll look to understand how well Redis is responding to application requests.
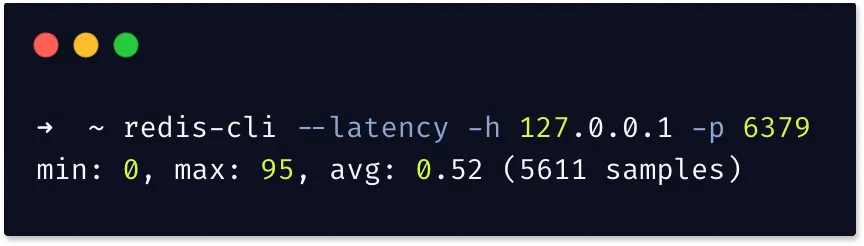
- Latency: This measures the time between a command being received and a response being sent. Since Redis typically operates with sub-millisecond latency, even small increases can be significant.
- Operations per second (ops/sec): The
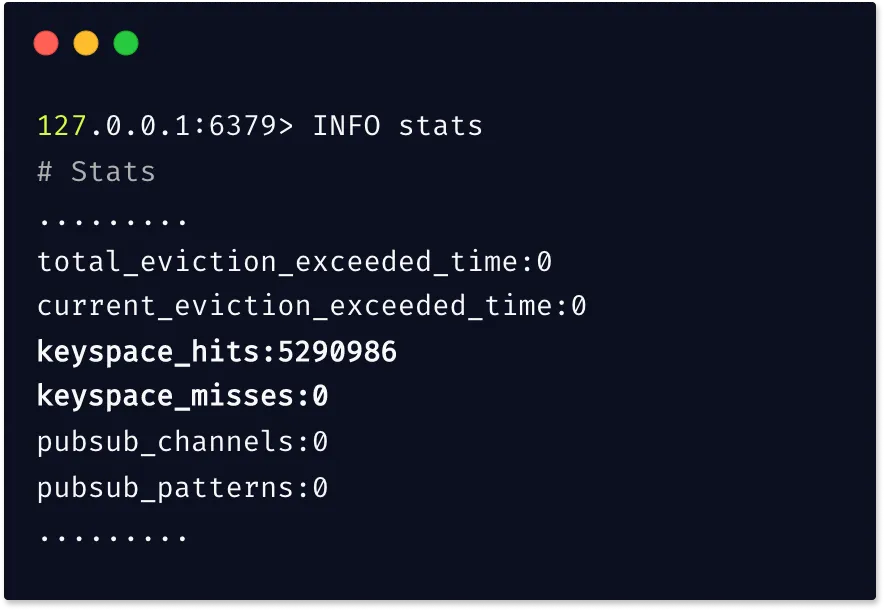
instantaneous_ops_per_secmetric gives you a view of Redis's throughput. If you see latency increasing while throughput remains constant, the issue may not be with Redis commands but with network or infrastructure problems. - Cache hit ratio: Calculated as
keyspace_hits / (keyspace_hits + keyspace_misses), this metric is crucial for caching workloads. A healthy ratio is typically above 90%. A low hit rate suggests that clients are frequently requesting keys that have been evicted or never existed. - CPU usage: As Redis is primarily single-threaded, CPU usage is a critical indicator of server load. High CPU can result from inefficient commands, high throughput, or background operations. It's important to monitor both Redis-specific and system-wide CPU usage to isolate the cause.
Memory Metrics
Memory management is arguably the most critical aspect of Redis monitoring, as all data is stored in RAM.
- used_memory: This represents the total bytes allocated by Redis for data. If this exceeds available system memory, the OS will start swapping to disk, which will severely degrade performance.
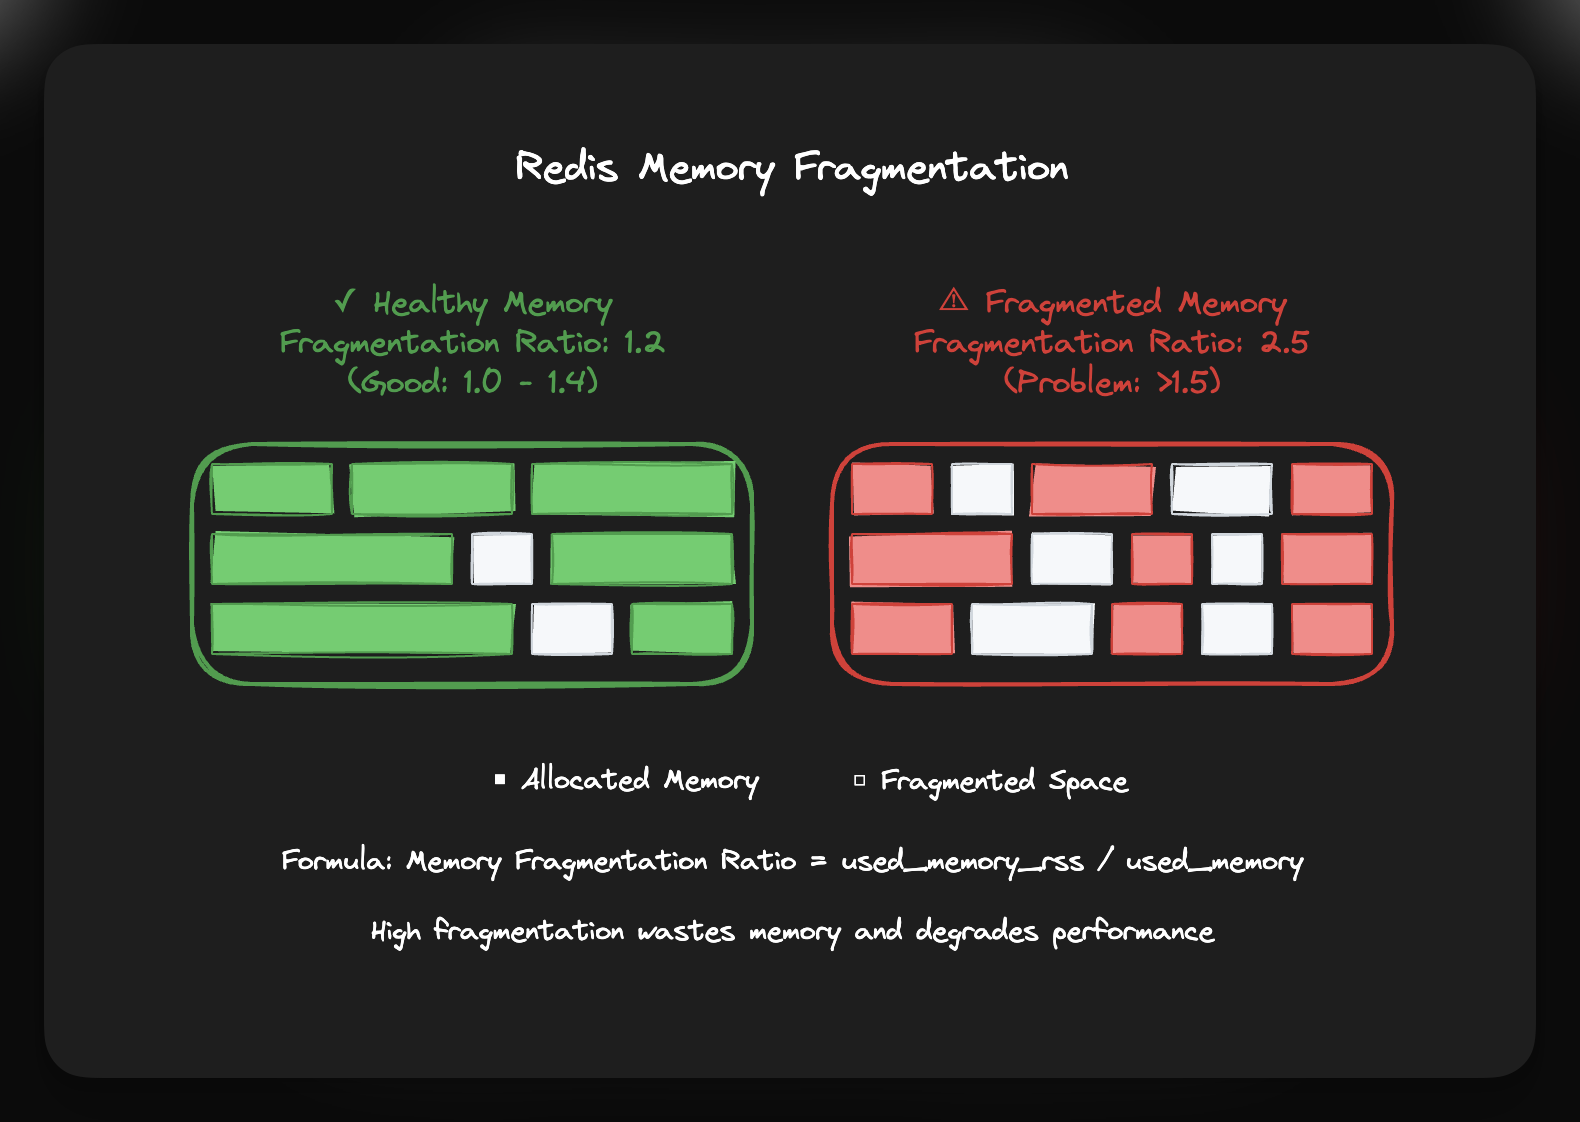
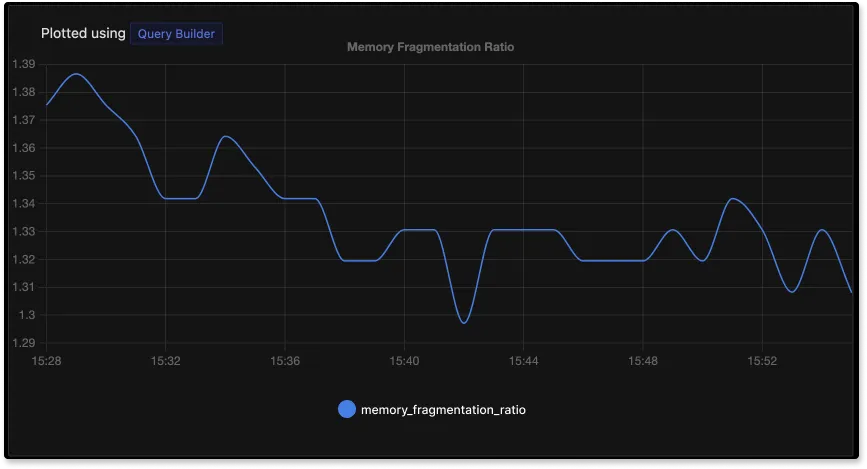
- Memory fragmentation ratio: Calculated as
used_memory_rss / used_memory, this metric indicates how efficiently memory is being used. A healthy ratio is generally between 1.0 and 1.4. A value below 1.0 is a critical issue, as it means Redis is using swap memory. If the ratio is consistently above 1.5, it suggests excessive fragmentation. Instead of restarting the server, consider enabling active defragmentation (available in Redis 4.0+), which can resolve fragmentation without downtime.
- evicted_keys: This metric counts the number of keys that have been removed because Redis has reached its memory limit. A high number of evicted keys may indicate that you need to allocate more memory or review your data retention policies.
- maxmemory configuration: This setting puts a cap on Redis's RAM usage, preventing it from consuming all available system memory. It's a critical setting for managing eviction policies and maintaining system stability.
- blocked_clients: This shows the number of clients waiting on blocking operations. A consistently high number can point to bottlenecks in your queues or slow consumers.
Activity Metrics
Beyond performance and memory, you also need to understand how clients are interacting with your Redis instance. These activity metrics provide insight into connection patterns and replication status.
- connected_clients: This tracks the number of active client connections. Sudden changes outside of normal ranges can indicate upstream connection issues or capacity problems.
- connected_replicas: If you are using Redis replication, this metric is crucial. An unexpected drop in the number of replicas can signal a host failure or other issues with your replica instances.
- master_last_io_seconds_ago: This measures the time since the last interaction between a primary and replica instance. If this value grows too large, you risk serving stale data and may trigger a full synchronization, which is an expensive operation.
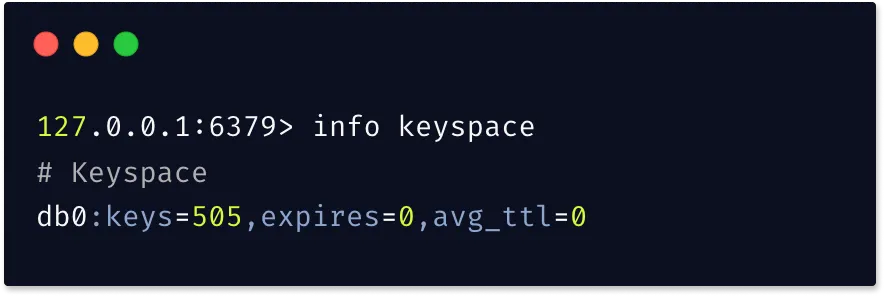
- keyspace_size: This tracks the total number of keys in your Redis instance. For caching workloads, this helps you anticipate when you might hit memory limits and need to adjust your eviction policies or add capacity.
Persistence Metrics
If you are using Redis for more than just caching, you'll want to monitor its persistence metrics to ensure data durability.
- rdb_last_save_time: This shows the Unix timestamp of the last successful dump to disk. A large gap between saves increases the risk of data loss in the event of a failure.
- rdb_changes_since_last_save: This indicates how much data has changed since the last save. Even with long intervals between saves, a low number of changes means a lower risk of data loss.
Error Metrics
Finally, error metrics are direct indicators of problems that require your attention.
- rejected_connections: If Redis reaches its
maxclientslimit, it will start rejecting connections. Any non-zero value for this metric indicates a capacity issue. - keyspace_misses: This metric increments when clients request non-existent keys. While some misses are expected in caching scenarios, a high number in other workloads can point to application bugs or inefficient queries.
- master_link_down_since_seconds: This metric appears when the connection between a primary and replica fails. To avoid serving stale data, this value should always be zero.
Redis Monitoring Tools Overview
The Redis monitoring landscape offers a variety of solutions, from built-in commands to enterprise-grade platforms.
Built-in Redis Tools
Redis provides several commands for on-the-spot monitoring and debugging:
- The INFO command provides a comprehensive set of server statistics. You can also request specific sections, such as
INFO memoryorINFO stats.redis-cli INFO memory # Memory used_memory:1463344 used_memory_human:1.40M used_memory_rss:2211840 used_memory_rss_human:2.11M mem_fragmentation_ratio:1.51 - The MONITOR command offers a real-time stream of commands being executed, but it has a significant performance impact and should be used sparingly in production.
- The Redis Slowlog tracks commands that exceed a configurable execution time, helping you identify performance bottlenecks.
CONFIG SET slowlog-log-slower-than 10000 SLOWLOG GET 10 - Latency monitoring, available since Redis 2.8.13, allows you to track performance events and diagnose latency issues.
Open Source Solutions
RedisInsight serves as the official GUI tool, providing real-time monitoring and performance analysis. While suitable for development, it lacks robust alerting needed for production.
Prometheus + Grafana represents a widely-used open-source stack. The Redis Exporter collects metrics, Prometheus stores time-series data, and Grafana provides visualization and alerting.
Benefits include complete infrastructure control and extensive customization options. However, setup and maintenance require significant effort.
SigNoz offers a modern approach to Redis monitoring through its OpenTelemetry-native observability platform, which we'll explore in detail in the next section.
Enterprise Solutions
- Redis Enterprise: Provides built-in monitoring through its management console, with real-time visualization, automated alerting, and cluster management features.
- Datadog, New Relic: These commercial platforms offer Redis monitoring as part of a broader observability solution. They typically provide automated setup and intelligent alerting but come with higher costs and potential vendor lock-in.
Monitoring Redis with SigNoz
SigNoz offers a modern approach to Redis monitoring through its OpenTelemetry-native observability platform. Unlike traditional monitoring tools, SigNoz provides full-stack visibility by correlating Redis metrics with application traces and logs.
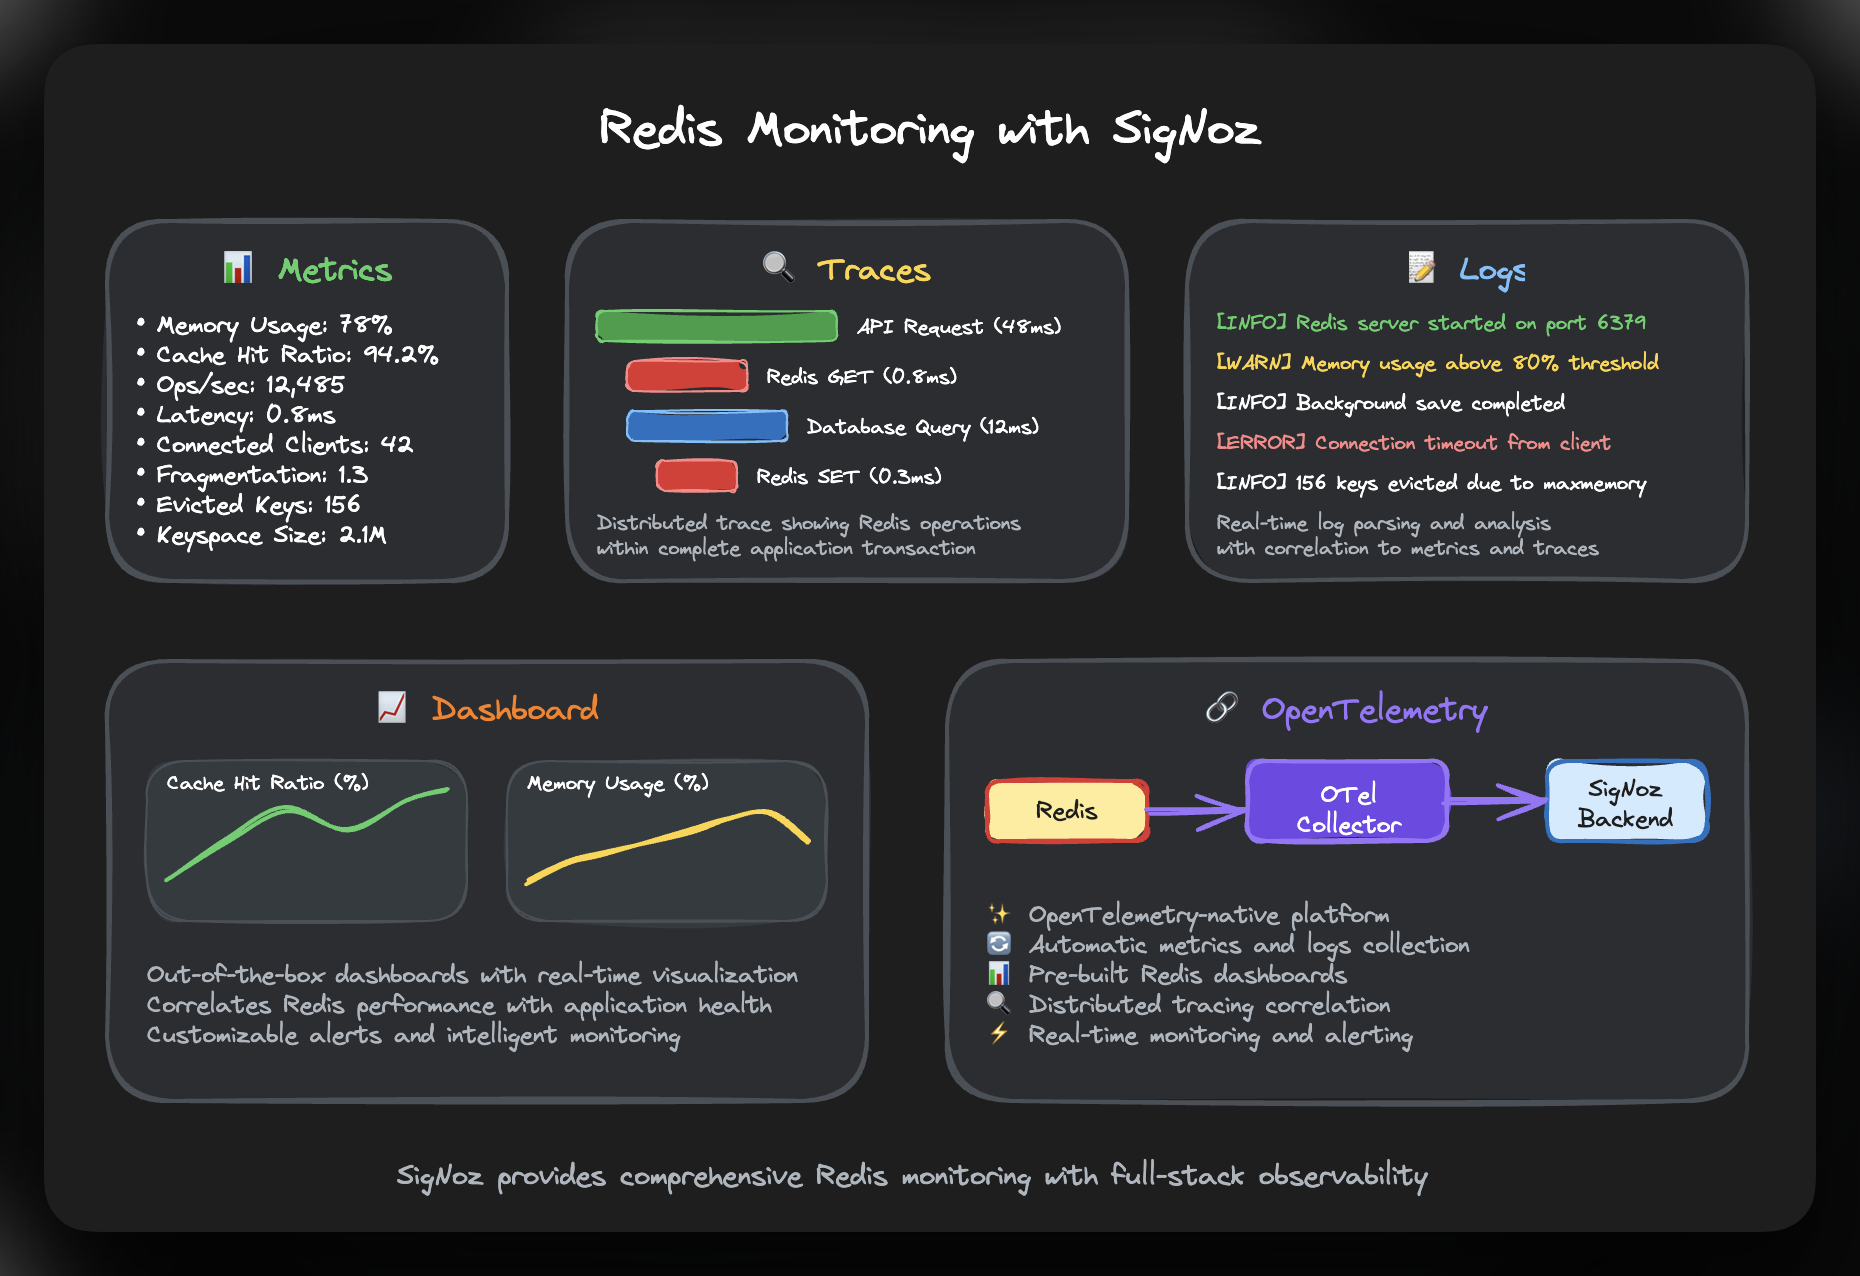
Key Features
SigNoz's Redis integration collects comprehensive metrics and logs through OpenTelemetry collectors, providing:
- Out-of-the-box dashboards for visualizing latency, error rates, and throughput
- Distributed tracing that shows Redis operations within complete application transactions
- Unified view correlating Redis performance with overall application health
- Real-time log parsing and analysis
Setup Process
Setting up Redis monitoring in SigNoz involves configuring the OpenTelemetry Collector with Redis-specific receivers and processors. The integration supports both metrics and logs collection from Redis instances.
For detailed setup instructions, refer to the SigNoz Redis integration documentation.
The setup process includes:
- Configuring the OpenTelemetry Collector with Redis receiver
- Setting up log collection from Redis server logs
- Accessing pre-built dashboards for immediate monitoring
What sets SigNoz apart is its ability to trace Redis operations within distributed transactions, making it easier to identify performance bottlenecks and understand Redis impact on overall application performance.
Get Started with SigNoz
SigNoz provides comprehensive Redis monitoring through its OpenTelemetry-native platform. The integration offers distributed tracing capabilities that show Redis operations within complete application transactions, plus pre-built dashboards for immediate visibility into your Redis performance.
You can choose between various deployment options in SigNoz. The easiest way to get started with SigNoz is SigNoz cloud. We offer a 30-day free trial account with access to all features.
Those who have data privacy concerns and can't send their data outside their infrastructure can sign up for either enterprise self-hosted or BYOC offering.
Setting Up Effective Monitoring
Establishing Baselines
Before you can set up effective alerts, you need to establish a performance baseline. Document the typical latency, memory usage, and throughput for your workload during normal operations. This will give you a reference point for identifying anomalies.
Key Monitoring Configurations
- Memory monitoring: Set alerts for when memory usage exceeds 80% for caching workloads or 90% if Redis is your primary database. Keep a close eye on fragmentation ratios and eviction rates.
- Performance tracking: Alert on any significant increase in latency above your baseline. For a Redis instance that typically responds in under 1ms, an alert at 5-10ms can provide an early warning.
- Connection monitoring: Track client connections and set alerts for sudden spikes or rejections. Monitor replication lag based on your consistency requirements.
Troubleshooting Common Issues
High Memory Usage
When Redis approaches its memory limit, performance can degrade quickly. This is often caused by inefficient data structures, missing TTL settings on keys, or simply not allocating enough memory.
Diagnostic steps:
- Analyze memory usage with
INFO memory. - Identify large keys using
MEMORY USAGE keynameor the--bigkeysoption. - Review your eviction policies and TTL settings.
- Consider optimizing your data structures.
Replication Lag
Replication lag can lead to data inconsistency and impact the reliability of your failover process.
Investigation steps:
- Monitor the
master_last_io_seconds_agometric. - Check the network connectivity between your primary and replica instances.
- Analyze the load and resource utilization on the primary instance.
- Review your replication buffer configurations.
Latency Spikes
High latency is often a sign of inefficient commands or resource contention.
Troubleshooting steps:
- Use the
SLOWLOGto identify problematic commands. - Analyze command patterns for inefficiencies.
- Check for background operations like
SAVEorBGSAVEthat may be consuming resources. - Monitor system-level resources to rule out broader issues.
Best Practices
Monitoring Strategy
Develop a monitoring strategy that is aligned with your specific Redis use case. If you are using Redis as a cache, you will want to prioritize hit rates and eviction patterns. If it's your primary database, you'll be more focused on durability and consistency metrics.
Alerting Configuration
Set meaningful alert thresholds that are sensitive enough to catch issues early but not so sensitive that they generate excessive noise. Start with conservative thresholds and adjust them based on your operational experience.
Integration Approach
Correlate your Redis metrics with application performance indicators. Understanding how Redis performance impacts the end-user experience will help you prioritize your optimization efforts more effectively.
Hope this guide has been helpful. If you have more questions, feel free to join our Slack community. You can also subscribe to our newsletter for more insights on observability, open source, and OpenTelemetry.
